
Julie Iriondo
Public Information Office
301-763-3030
pio@census.gov
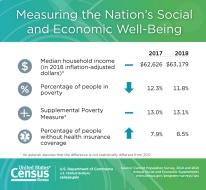
(Black PR Wire) Washington, DC -- The U.S. Census Bureau announced today the median household income was not statistically different from the 2017 median, and the official poverty rate decreased 0.5 percentage points from 2017. At the same time, the rate and number of people without health insurance increased from 7.9%, or 25.6 million, in 2017 to 8.5%, or 27.5 million, in 2018.
Median household income was $63,179 in 2018, not statistically different from the 2017 median, following three consecutive years of annual increases. Between 2017 and 2018, the real median earnings of all workers increased 3.4% to $40,247. The 2018 real median earnings of men and women who worked full-time, year-round increased by 3.4% and 3.3%, respectively, between 2017 and 2018. The difference between the 2017-2018 percent changes in median earnings for men and women working full-time, year round was not statistically significant. The number of full-time, year-round workers increased by 2.3 million, between 2017 and 2018. The number of men and women full-time, year-round workers increased by about 700,000 and 1.6 million, respectively.
The official poverty rate in 2018 was 11.8%, a decrease of 0.5 percentage points from 2017. This is the fourth consecutive annual decline in the national poverty rate. In 2018, for the first time in 11 years, the official poverty rate was significantly lower than 2007, the year before the most recent recession. The number of people in poverty in 2018 was 38.1 million, 1.4 million fewer people than 2017.
The percentage of people with health insurance coverage for all or part of 2018 was 91.5%, lower than the rate in 2017 (92.1%). Between 2017 and 2018, the percentage of people with public coverage decreased 0.4 percentage points, and the percentage of people with private coverage did not statistically change.
These findings are contained in two reports: Income and Poverty in the United States: 2018 and Health Insurance Coverage in the United States: 2018.
Another Census Bureau report, The Supplemental Poverty Measure: 2018, was also released today. The supplemental poverty rate in 2018 was 13.1%, not statistically different from the 2017 supplemental poverty rate of 13.0%. The Supplemental Poverty Measure (SPM) provides an alternative way of measuring poverty in the United States and serves as an additional indicator of economic well-being. The Census Bureau has published poverty estimates using the SPM annually since 2011 with the collaboration of the Bureau of Labor Statistics.
The Current Population Survey, sponsored jointly by the Census Bureau and Bureau of Labor Statistics, is conducted every month and is the primary source of labor force statistics for the U.S. population; it is used to calculate the monthly unemployment rate estimates. Supplements are added in most months; the Annual Social and Economic Supplement is designed to give annual, national estimates of income, poverty and health insurance numbers and rates. The most recent Annual Social and Economic Supplement was conducted nationwide (February, March and April 2019) and collected information about income and health insurance coverage during the 2018 calendar year.
The Current Population Survey-based income and poverty report includes comparisons with the previous year, and historical tables in the report contain statistics back to 1959. The health insurance report is based on both the Current Population Survey and the American Community Survey. State and local income, poverty and health insurance estimates from the American Community Survey will be released Thursday, Sept. 26.
For the first time, income, poverty and health insurance measures in these reports will reflect important changes to the processing system for the Current Population Survey Annual Social and Economic Supplement (CPS ASEC). These reports present year-to-year comparisons from 2017 to 2018 based on data edited using the updated processing system for both years. In some cases, 2017 estimates may differ from values published in September 2018, which were created using the legacy processing system. For more information on the updates to the processing system see the CPS ASEC Redesign and Processing Changes.
Income
- Median household income was $63,179 in 2018, not statistically different from the 2017 median.
- The 2018 real median income of family households and nonfamily households increased 1.2% and 2.4%, respectively, between 2017 and 2018. This is the fourth consecutive annual increase in median household income for family households. The difference between the 2017-2018 percent changes in median income for family (1.2%) and nonfamily (2.4%) households was not statistically significant.
- For householders under the age of 65, real median household income was not statistically different between 2017 and 2018, while real median household income for householders age 65 and over increased 3.3% from 2017. The difference between the 2017-2018 percent changes in median income for householders under the age of 65 (1.0%) and householders age 65 and over (3.3%) was not statistically significant.
Race and Hispanic Origin
(Race data refer to people reporting a single race only; Hispanics can be of any race.)
- The 2018 real median income of Asian households increased 4.6% from 2017 to $87,194, while the real median incomes of non-Hispanic white ($70,642), black ($41,361) and Hispanic ($51,450) households were not statistically different from their 2017 medians. The only significant difference between the 2017-2018 percent changes in median income for each race group was Asian (4.6%) and Hispanic (0.1%).
Nativity
- The real median income of households maintained by a native-born person increased 1.4% between 2017 and 2018, while the 2018 real median income of households maintained by a foreign-born person was not statistically different from 2017. The difference between the 2017-2018 percent changes in median income for households maintained by a native-born person (1.4%) and those maintained by a foreign-born person (1.7%) was not statistically significant.
Earnings
- Between 2017 and 2018, the real median earnings of all workers increased 3.4% to $40,247.
- The 2018 real median earnings of men ($55,291) and women ($45,097) who worked full-time, year-round increased by 3.4% and 3.3%, respectively, between 2017 and 2018. The difference between the 2017-2018 percent changes in median earnings for men (3.4%) and women (3.3%) working full-time, year-round was not statistically significant.
- The 2018 female-to-male earnings ratio was 0.816, not statistically different from the 2017 ratio.
- The number of full-time, year-round workers increased by 2.3 million, between 2017 and 2018. The number of men and women full-time, year-round workers increased by about 700,000 and 1.6 million, respectively.
Poverty
- The official poverty rate in 2018 was 11.8%, down 0.5 percentage points from 12.3% in 2017 (the Office of Management and Budget determined the official definition of poverty in Statistical Policy Directive 14). This is the fourth consecutive annual decline in poverty. Since 2014, the poverty rate has fallen 3.0 percentage points, from 14.8% to 11.8%.
- In 2018, for the first time in 11 years, the official poverty rate was significantly lower than 2007, the year before the most recent recession.
- In 2018, there were 38.1 million people in poverty, approximately 1.4 million fewer people than 2017.
Families
(Families are a group of two or more people related by birth, marriage or adoption and living together. A primary family is a family which includes the householder.)
- In 2018, the poverty rate for primary families declined from 9.3% to 9.0%.
- For primary families with a female householder, the poverty rate was 24.9%, a decline from 26.2% in 2017.
- The poverty rate for married-couple families was 4.7% in 2018. For primary families with a male householder, the poverty rate was 12.7%. Differences in the poverty rate for married-couple families and male-householder families were not statistically significant between 2017 and 2018.
Race and Hispanic Origin
(Race data refer to people reporting a single race only; Hispanics can be of any race.)
- The poverty rate for non-Hispanic whites was 8.1% in 2018, down from 8.5% in 2017.
- The poverty rate for blacks was 20.8%, while the poverty rate for Asians was 10.1%. The poverty rate for Hispanics was 17.6%. Among blacks, Asians and Hispanics, 2018 poverty rates were not statistically different from 2017.
Sex
- The 2018 poverty for males was 10.6%, not statistically different from 2017. The 2018 poverty rate for females was 12.9%, down from 13.6% in 2017.
Region
- From 2017 to 2018, the South was the only region not to experience a decline in its poverty rate. The 2018 poverty rate for those in the South was 13.6%.
- The 2018 poverty rate for the Northeast was 10.3%, down from 11.3% in 2017. The 2018 poverty rate for the Midwest was 10.4%, down from 11.2%. The poverty rate for the West in 2018 was 11.2%, down from 11.9% in 2017.
- The South had the highest poverty rate in 2018 at 13.6% while poverty rates were lowest in the Northeast and Midwest (the rate of 10.3% in the Northeast was not statistically different from the rate of 10.4% in the Midwest).
Age
- Between 2017 and 2018, poverty rates for children under age 18 decreased 1.2 percentage points from 17.4% to 16.2%. Poverty rates decreased 0.4 percentage points for adults ages 18 to 64, from 11.1% to 10.7%.
- The poverty rate for those age 65 and older (9.7%) was not statistically different from 2017.
Education
(Limited to individuals age 25 and older.)
- From 2017 to 2018, the poverty rate decreased for those with some college education, from 9.0% to 8.4%. Individuals with an associate degree are included in the som